The Merge and “New Home”
“Portal” will go into a curated collection of cryptoart supporting Ethereum development at the edge of The Merge
“New Home of the Heart” is a collection curated by JPG, Stateful Works and Sofia Garcia to commemorate The Merge and support Ethereum development. An auction will be released this week Monday Sep. 12th, 2022. I’m very excited to be included among those who contributed!
https://jpg.space/mint/NewHomeOfTheHeart/comingsoon
“New Home” is an exciting initiative, about 50% will go to supporting the large team of Ethereum developers who’ve contributed. See this touching “Merge Manual” statement by Stateful Works, containing extensive quotes from developers and other contributors about their efforts and their views on the significance of The Merge. E.g., by Adrian Sutton:
The Merge is a technical marvel. The security, diversity and environmental benefits it brings are amazing enough, but replacing the very core of how the blockchain works while it’s running is just next level.
Another by dankrad:
The Merge is probably the most major upgrade any blockchain with major usage has ever attempted. The direct benefits of reduced waste, reduced issuance, and a major increase in security are already phenomenal.
There are many wonderful quotes, with touching personal ingredients and lots of very instructive, insightful technical notes about past and future.
The “New Home” collection will support the wide community of developers through the Protocol Guild.
I’ve contributed a visualization that takes a perspective through data, using TTD, difficulty and time to express sentiments around The Merge and its changes (see the amazingly detailed and authoritative Coin Metrics review of this event and its history). Like my other projects, “Portal” is a visual that is tightly anchored to raw, on-chain data but yields some conceptual expression that goes beyond it — from that arrangement of data alone.

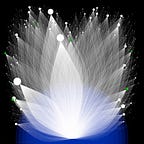
“Portal”
Arranged from raw data; 20,000 x 20,000 pixels, ~20 MB
(Click here to see the full-size asset on Arweave)

This visualization is the first in a series I’m working on that depict data from the perspective of an observer embedded in some way in the data.
Often data is depicted as apart from the observer, such as on a two-dimensional plane, like a graph. It is held at arm’s length. Away from the self. This series asks the observer to imagine themselves intrinsically situated relative to some data, from a given perspective.
This exercise can alter one’s sense of scale and dimension, sometimes in imposing or mysterious ways.

In this case, we depict Ethereum’s growing terminal total difficulty (TTD) over time. This visual situates the observer at the precipice of The Merge. The observer turns, looking back at history. Each ring represents a date, the “closer” the closer in time. Ring area is proportional to the TTD on that date going back in time. An array is interconnected by markers on four equidistant locations, and their area is proportional to the average difficulty on that ring’s day: mass energy supporting an unbroken chain extending back years. Despite this edifice, change is upon the observer. The structure is at its last ring, off like a switch.
“Portal” depicts the observer about to escape this energy-consuming reticulum into something beyond. You can imagine the observer turning, looking beyond the last ring. What’s next?
More notes: Variation on this piece is rendered entirely deterministically from data with only adjustments to get it squarely into view (minus some aesthetic choice of shapes, etc.). An important ingredient here is that I also wanted the data to seem spatial — time is extending back in space, too. To do this, I scaled the raw data by time in a manner that physical objects do in space, using the size/distance quotient (in essence, dividing the scale that occupies view by its remoteness in time). Opacity and y-axis are scaled by time as well, to give this data the visual feel of visuospatial depth, a history extending back from the observer. (Resizing views of “Portal” can also create a sparkling aliasing, star-like shapes in the overlapping rings, echoing again the underlying ideas of an energy-consuming landscape that precedes the observer.)