Weird Wednesdays: Another case study in how on-chain applications can skew coin metrics

This brief post explains a weird trend: Stellar’s active wallet addresses spike on Wednesdays, sometimes by 1,000%. Here I summarize some amateur chain archaeology I conducted to look for the answer. I share a strong candidate explanation below.
In a prior post, I showed how Bitcoin Cash and Litecoin have coin metrics that may be pushed around by an on-chain application. “Bitcoin Aliens” is a kind of gambling app that participates in a weekly giveaway. BCH and LTC versions of this app seemed to cause active addresses to rise during that giveaway. The takeaway: A single application might be skewing the important metric of active addresses.
This sort of boost to active addresses has also been seen on the Stellar network for years. It seemed to be related to its inflation period. Once a week a “vote” would take place, and Stellar would assign certain percentage of XLM to inflation wallets. This boosts unique addresses too, as described in Antoine Le Calvez’s amazing post on the subject.
Inflation ended in October, 2019. So we’d expect this weekly rise in active addresses to end. It hasn’t. Below is a chart I shared on Twitter a few months ago, illustrating the issue. These show active addresses relative to the most inactive day of the week (Sunday).
Most of these data were from transactions after Stellar’s inflation period, after their protocol upgrade. As you can see, on Wednesdays, Stellar still has a massive boost in active addresses, sometimes over 1,000%. As a follow up, I recently went back to the amazing community network data charts on Coin Metrics. In the past few months you can still see this odd Wednesday boost.

What might be driving this? There are clever ways to do chain archaeology without digging too deeply into block data. Nic Carter has a wonderful illustration of this, shown below. His analysis revealed that a recent decline in the Bitcoin transaction count might be related to Coinbase’s adoption of batching. In this case, he combined multiple Coin Metrics data to get important clues.
With active addresses though, the issue can seem trickier. In Nic’s example, the external knowledge of Coinbase’s update served as a clue. What could be the outside force acting on Stellar chain here? A Google expedition yielded little for me, and in the absence of information outside the aggregate data, we need more.
Clues can come from transaction patterns on the chain. We need to know if the active addresses are resulting from many-to-one transactions, one-to-many, or just a flood of many-to-many transactions. These patterns could emerge from different uses. For example, an application might resolve peer-to-peer events once a week, meaning a many-to-many pattern would be present on chain. This might be difficult to uncover, as there is no single “anchor wallet” that reveals the trend. The set of such transactions might be needles in a haystack.
On the other hand, many-to-one or one-to-many transactions in relevant blocks would offer a clue. A combination of these might be the source of the active address boost. In “Bitcoin Aliens,” noted above, the application’s wallets were transacting with large numbers of players’ wallets. We can then use various strategies to determine the source of these specific transactions. These many-to-one/one-to-many transactions can serve as big “spikes in a haystack.”
In a search for some spikes, I sought some raw block data. I used the free version of Amberdata’s nice on-chain data. I could not download the entire blockchain around dates of interest. The ledger system of Stellar’s network leads to huge amounts of data, spread across blocks that are confirmed every few seconds. But consider the active address boost XLM sees, in the charts above. The only way that this would be possible is if the effect stretched across many blocks on relevant days. So I took a sampling approach, grabbing blocks at regular intervals from February to April until I found blocks that clearly contained these spikes. It worked. I sampled only 300 out of 1,276,188 possible blocks. An illustration of this is below.
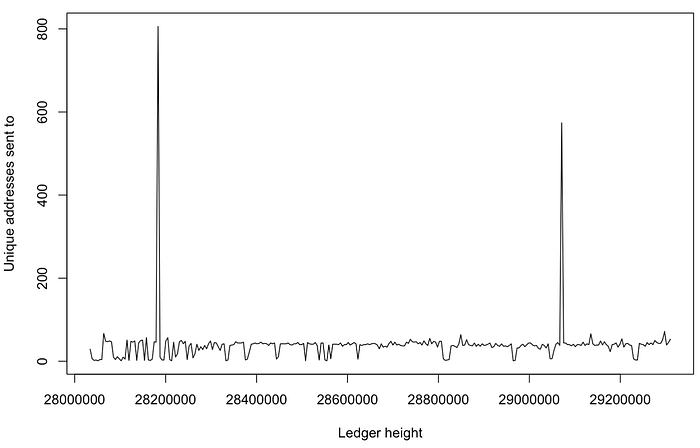
I zoomed into these two blocks, sampling blocks around them. Lots of one-to-many transactions. For example, this Stellar wallet sent to over 100 wallets in a single transaction. In Stellar parlance, this transaction contained 100 “operations.”
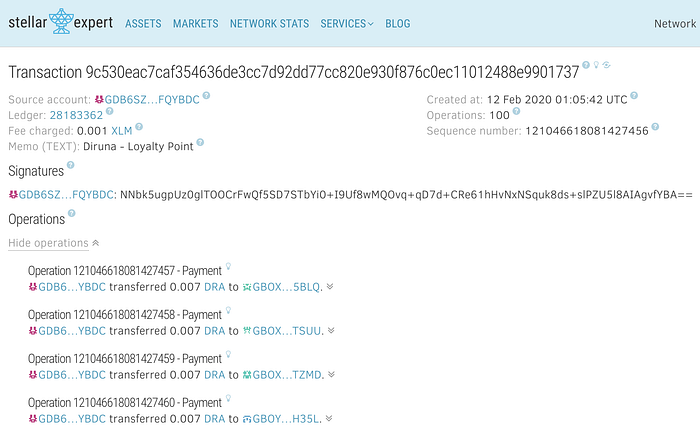
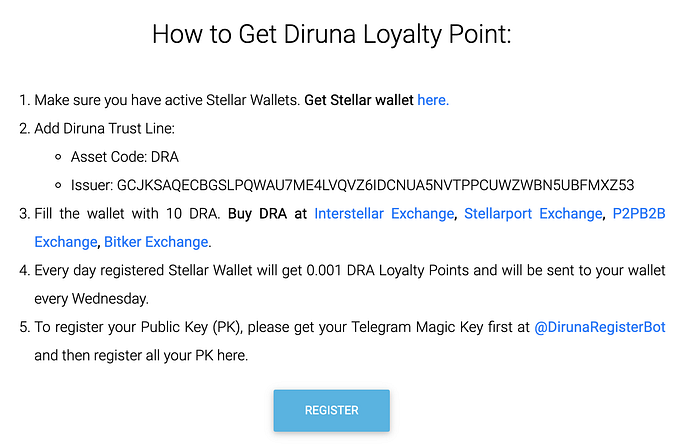
As you can see, this is not a transaction of XLM. It’s a transaction of a token created on the Stellar network called “Diruna” (DRA). What is Diruna? Off to Google. Lo:
Stellar Expert’s blockchain explorer has a great plotting tool to look at date-by-date activity of this asset. It reveals the periodic Wednesday trend:

Unfortunately, this plot shows volume in DRA, not total transactions or addresses. That makes the seasonality less clear. Given the recent rise in volume, and the relative similarity of active addresses, we would predict that DRA giveaways increased in value. Comparing the Diruna site above to that sample transaction supports this prediction: The original giveaway was 0.001 DRA, but the recent transactions raised this prize to .007.
This seems like the culprit. Diruna has a detailed white paper about how it is engaging wider communities in crypto usage. I do not endorse it, but here it is if you are curious. Its website unfortunately has that taint of failing links suggesting the project is not serious or deceased (these links were a post-archaeology discovery: Stellar community on Reddit discussing DRA).
A final clue comes from putting the Coin Metrics active addresses side-by-side with the account-holders plot from Stellar Expert. Note the close alignment in raw values here. The spike in active addresses seems to be entirely accounted for in the raw number of DRA asset holders.

In sum, it appears Stellar’s active addresses are boosted by an on-chain token, a loyalty application called Diruna. As Antoine Le Calvez notes in his blog post about Stellar’s inflation period, these patterns illustrate the importance of statistically controlling for idiosyncratic features of chains. In this case, you might sum or average across a week, or statistically remove seasonalities at various scales.
Even better, you might dig into the Stellar block data and clip out tokens or assets that may be skewing the stats. Cleaning up the “pollution,” as some have called it.
I hope you found this interesting.
If so, follow me on Twitter: @takenstheorem